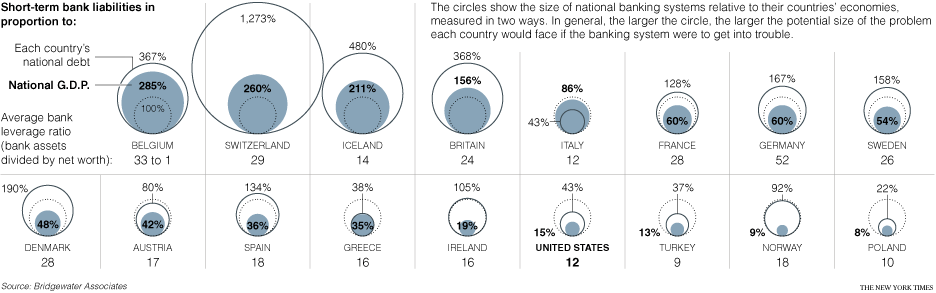
 The US is not in bad shape compared to 13 countries in Europe. Wow! Look at the chart: the US's circles are small and small is good here. Click on the chart to enlarge it.
NYTimes.com:
The accompanying chart shows the size of national banking systems relative to their countries’ economies, measured in two ways, and also show how well capitalized the banks appear to be, through the latest reported data.
In general, higher figures in any of the graphics indicate increased danger. They do not pretend to show what shape the banks are in, but they do reflect the size of the problem each country would face if its banking system did get into trouble.
The first two charts look not at deposits but at short-term debt carried by the banks. The banks usually have long-term debt as well. But by its nature, that debt cannot be withdrawn if worries about a bank’s solvency suddenly increase. They also have deposits, but deposits are less likely to flee, at least if deposit guarantee systems are trusted. Short-term debt, on the other hand, matures within a year and may not be available to a bank that is in trouble.
The first comparison — the tinted circles — looks at the size of bank short-term debt as a percentage of a country’s gross domestic product. Such figures are not directly comparable, since one is the total amount of income in a country over a year, and the other is the amount owed by banks that may have to be paid over that year. But the comparisons do show relative sizes.
In the United States, the banks have total short-term debt that is equal to 15 percent of G.D.P. But in some countries where banking systems have grown to international proportions, the debt exceeds G.D.P. That is true in Switzerland, Belgium, Iceland and Britain.
The second comparison — the open circles — looks at the short-term bank debt in relation to each country’s national debt.
Again, the relationship is not direct, because a country may have excellent credit that would enable it to borrow much more, but large numbers still raise questions.
“Can they guarantee the deposits if the bank owes 3.5 times the national debt?” asked Bob Prince, the co-chief investment officer of Bridgewater Associates, which provided the data.
For countries in the euro zone, there is an additional consideration. They do not have the right to print money. That may also be true for some other banking systems, if the liabilities are primarily in currencies other than their own. Those countries could face special problems if they needed to come up with huge amounts of cash to rescue banks.
Finally, the leverage ratio gives a rough indication of how risky a nation’s banking system might be. It is the ratio of total bank assets to the net worth of the bank. That could be misleading if the assets are very safe — government bonds, for example, versus subprime mortgage loans — but in general the higher the ratio the smaller the margin of safety.
There again, the United States appears to face a relatively small problem, with an average leverage ratio of 12. The figures range up to 52 in Germany. Theoretically, a 2 percent drop in the value of all German bank assets would wipe out the net worth of the banking system.
The chart shows the relative size of each country's problems. The dotted circle represents the denominator: for the filled circle it is GDP; for the hollow circle it is national debt.
The US is not in bad shape compared to 13 countries in Europe. Wow! Look at the chart: the US's circles are small and small is good here. Click on the chart to enlarge it.
NYTimes.com:
The accompanying chart shows the size of national banking systems relative to their countries’ economies, measured in two ways, and also show how well capitalized the banks appear to be, through the latest reported data.
In general, higher figures in any of the graphics indicate increased danger. They do not pretend to show what shape the banks are in, but they do reflect the size of the problem each country would face if its banking system did get into trouble.
The first two charts look not at deposits but at short-term debt carried by the banks. The banks usually have long-term debt as well. But by its nature, that debt cannot be withdrawn if worries about a bank’s solvency suddenly increase. They also have deposits, but deposits are less likely to flee, at least if deposit guarantee systems are trusted. Short-term debt, on the other hand, matures within a year and may not be available to a bank that is in trouble.
The first comparison — the tinted circles — looks at the size of bank short-term debt as a percentage of a country’s gross domestic product. Such figures are not directly comparable, since one is the total amount of income in a country over a year, and the other is the amount owed by banks that may have to be paid over that year. But the comparisons do show relative sizes.
In the United States, the banks have total short-term debt that is equal to 15 percent of G.D.P. But in some countries where banking systems have grown to international proportions, the debt exceeds G.D.P. That is true in Switzerland, Belgium, Iceland and Britain.
The second comparison — the open circles — looks at the short-term bank debt in relation to each country’s national debt.
Again, the relationship is not direct, because a country may have excellent credit that would enable it to borrow much more, but large numbers still raise questions.
“Can they guarantee the deposits if the bank owes 3.5 times the national debt?” asked Bob Prince, the co-chief investment officer of Bridgewater Associates, which provided the data.
For countries in the euro zone, there is an additional consideration. They do not have the right to print money. That may also be true for some other banking systems, if the liabilities are primarily in currencies other than their own. Those countries could face special problems if they needed to come up with huge amounts of cash to rescue banks.
Finally, the leverage ratio gives a rough indication of how risky a nation’s banking system might be. It is the ratio of total bank assets to the net worth of the bank. That could be misleading if the assets are very safe — government bonds, for example, versus subprime mortgage loans — but in general the higher the ratio the smaller the margin of safety.
There again, the United States appears to face a relatively small problem, with an average leverage ratio of 12. The figures range up to 52 in Germany. Theoretically, a 2 percent drop in the value of all German bank assets would wipe out the net worth of the banking system.
The chart shows the relative size of each country's problems. The dotted circle represents the denominator: for the filled circle it is GDP; for the hollow circle it is national debt.
Monday, October 13, 2008
Off the Charts - Europe Banks Could Prove Too Big to Fail; or to Rescue
The US is not in bad shape compared to 13 countries in Europe. Wow! Look at the chart: the US's circles are small and small is good here. Click on the chart to enlarge it.
NYTimes.com:
The accompanying chart shows the size of national banking systems relative to their countries’ economies, measured in two ways, and also show how well capitalized the banks appear to be, through the latest reported data.
In general, higher figures in any of the graphics indicate increased danger. They do not pretend to show what shape the banks are in, but they do reflect the size of the problem each country would face if its banking system did get into trouble.
The first two charts look not at deposits but at short-term debt carried by the banks. The banks usually have long-term debt as well. But by its nature, that debt cannot be withdrawn if worries about a bank’s solvency suddenly increase. They also have deposits, but deposits are less likely to flee, at least if deposit guarantee systems are trusted. Short-term debt, on the other hand, matures within a year and may not be available to a bank that is in trouble.
The first comparison — the tinted circles — looks at the size of bank short-term debt as a percentage of a country’s gross domestic product. Such figures are not directly comparable, since one is the total amount of income in a country over a year, and the other is the amount owed by banks that may have to be paid over that year. But the comparisons do show relative sizes.
In the United States, the banks have total short-term debt that is equal to 15 percent of G.D.P. But in some countries where banking systems have grown to international proportions, the debt exceeds G.D.P. That is true in Switzerland, Belgium, Iceland and Britain.
The second comparison — the open circles — looks at the short-term bank debt in relation to each country’s national debt.
Again, the relationship is not direct, because a country may have excellent credit that would enable it to borrow much more, but large numbers still raise questions.
“Can they guarantee the deposits if the bank owes 3.5 times the national debt?” asked Bob Prince, the co-chief investment officer of Bridgewater Associates, which provided the data.
For countries in the euro zone, there is an additional consideration. They do not have the right to print money. That may also be true for some other banking systems, if the liabilities are primarily in currencies other than their own. Those countries could face special problems if they needed to come up with huge amounts of cash to rescue banks.
Finally, the leverage ratio gives a rough indication of how risky a nation’s banking system might be. It is the ratio of total bank assets to the net worth of the bank. That could be misleading if the assets are very safe — government bonds, for example, versus subprime mortgage loans — but in general the higher the ratio the smaller the margin of safety.
There again, the United States appears to face a relatively small problem, with an average leverage ratio of 12. The figures range up to 52 in Germany. Theoretically, a 2 percent drop in the value of all German bank assets would wipe out the net worth of the banking system.
The chart shows the relative size of each country's problems. The dotted circle represents the denominator: for the filled circle it is GDP; for the hollow circle it is national debt.
Subscribe to:
Post Comments (Atom)

2 comments:
Nice post. I've just added it to my bookmark list.. Debt Collection
Post a Comment